Daily Productivity Tracking Sheet
Download the Daily Productivity Tracking Sheet (Excel)
Setting up the Spreadsheet
Revenue can be tracked and predicted using an Excel file. All of the months in the year can be separate tabs on one spreadsheet or one spreadsheet can be used per quarter with one spreadsheet per month on each tab. For example, Excel file “2019 3Q Productivity” has three tabs: July, Aug, Sept. Here is how each month is set up:
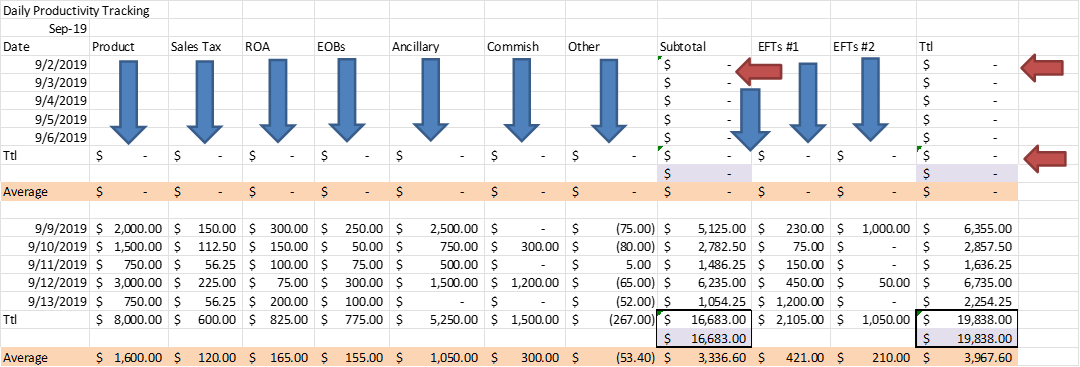
The above shows a column for each in-office revenue stream, (Product, Sales Tax, ROA, EOB, etc.) and total at the end of each week. The Subtotal of the in-office revenue streams are added to EFT #1 and EFT #2 for the Total. The purple boxes total the revenue streams and EFTs by row. This should match the column total above each purple box for error checking, (shown in Table 1 the second week with the bold boxes for $16,683 and $19,838).
The structure of the spreadsheet should reflect the basis of the practice’s operations. In this case, the Subtotal is the amount that was collected in the office each day. Electronic Fund Transfers (EFTs) came into two accounts and were added by Billing staff to reach the Total for each day. This amount was then posted and reconciled in the accounting software.
Projecting Revenue
Once the spreadsheet is setup, it can be used to project revenue based on daily averages, as follows:

This spreadsheet shows the third week of revenue for September, (with the second week’s revenue not shown and no revenue for the first week of September). The blue box shows the total revenue days for the month of 15, (five days week two, five days week three and five days week for). The red box shows the total days for which revenue has been entered, (weeks two and three). The daily average is the green row, (total revenue divided by the red box).
Revenue is projected in the row with the blue box by taking the total revenue days times the daily average (green row). The bold box on Table 2 shows that with current revenue of $36,490.50, monthly revenue is projected at $54,735.75.
Evaluating Productivity
Adding the previous months’ daily averages allows for tracking the performance of the current month’s daily average.
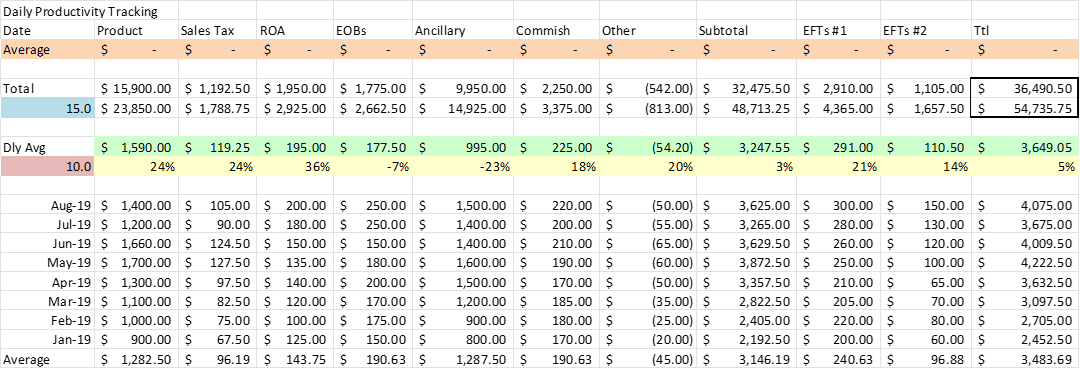
The yellow row shows the current’s month percentage above or below previous months’ daily averages. This is calculated by taking the current month’s daily average, (in green) and dividing it by the monthly average for previous months, (last row). In this month, EOBs and Ancillary revenue are performing below average, while the rest of the revenue streams are above average.